Monthly Temperature Distribution Analysis: Lincoln
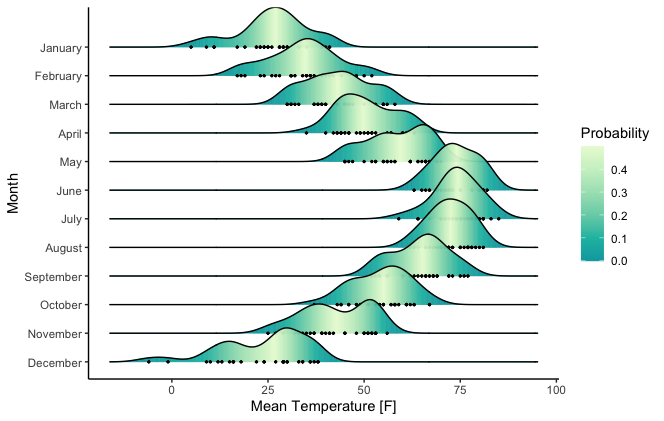
A ridge plot visualization of monthly temperature distributions in the Lincoln region using density gradients and jittered points.
This analysis presents the monthly temperature distributions in the Lincoln region through a ridge plot (the sample data is from “ggridges” package). The plot visualizes the density of mean temperatures for each month of the year, providing insights into seasonal temperature variations and their distributions.
Analysis Overview
The ridge plot shows the mean temperature distribution for each month, utilizing density ridges to illustrate the probability density function. The plot also includes jittered points to depict individual data observations, giving a more granular view of temperature variability within each month.
Key Findings
Seasonal Trends: The plot reveals distinct seasonal temperature patterns. Winter months like January and February have lower temperatures, while summer months such as July and August feature higher temperatures.
Temperature Variability: The density ridges’ width and height reflect the temperature variability each month. Winter months have narrower distributions with lower peaks, indicating a tighter range of temperatures. In contrast, summer months exhibit broader distributions with higher peaks, suggesting a wider range of temperatures.
Probability Density: The color gradient within each ridge, ranging from yellow to green to blue, represents temperature probability density. Lighter colors indicate lower density (fewer occurrences), while darker colors indicate higher density (more occurrences).
Visualization
The ridge plot below visualizes the mean temperature distributions for each month in the Lincoln region. 
Tools Used
- R: The plot was generated using R with the
ggplot2andggridgeslibraries for data visualization.
This analysis provides a detailed perspective on the temperature distributions across different months in the Lincoln region, offering a view into seasonal weather patterns and variability.
