
Mapping Crime Exposure Risk in London
Yujing Yang
This analysis explores patterns of human mobility and exposure to urban crime risks in Greater London.
Analysis Overview
- Objective: Detect and visualise spatial hotspots in Greater London where residents are most exposed to crime-related risks, leveraging location-based social network data and auxiliary urban datasets.
- Approach:
- Risk Index Construction: Built a “threat index” using a Random Forest model
- Trajectory Analysis: Tracked user movement paths with smartphone data.
Key Findings
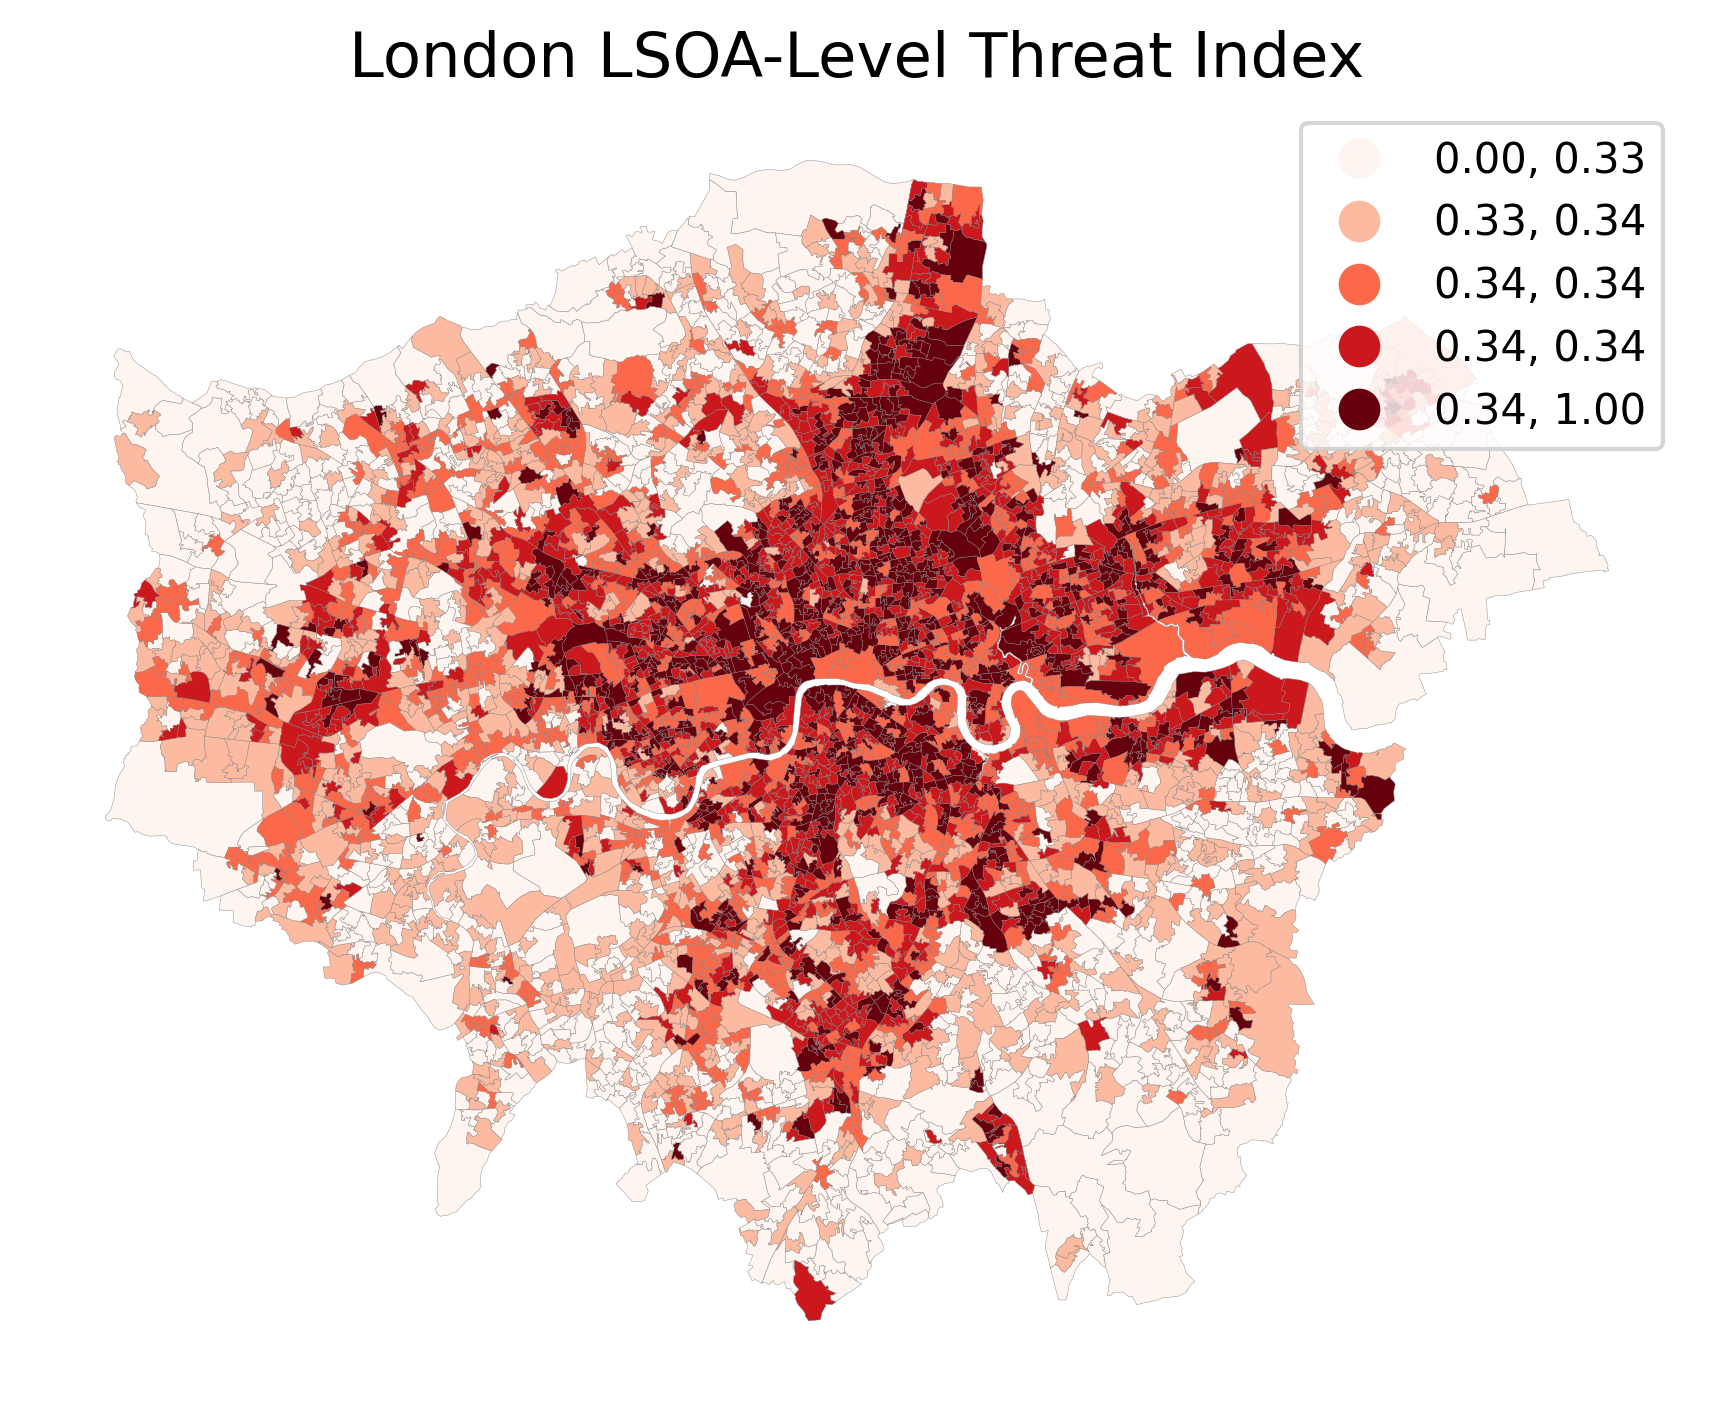
- Fine-Grained Risk Mapping: Generated spatial risk maps at LSOA scale, revealing pronounced clusters of high exposure risk in Central and East London.
- Resident-Filtered Analysis: By focusing on stable users (3+ months), the analysis reflects actual daily risks faced by London residents.
Visualization
A sample map below visualises the spatial distribution of threat indices and path trajectory across London: 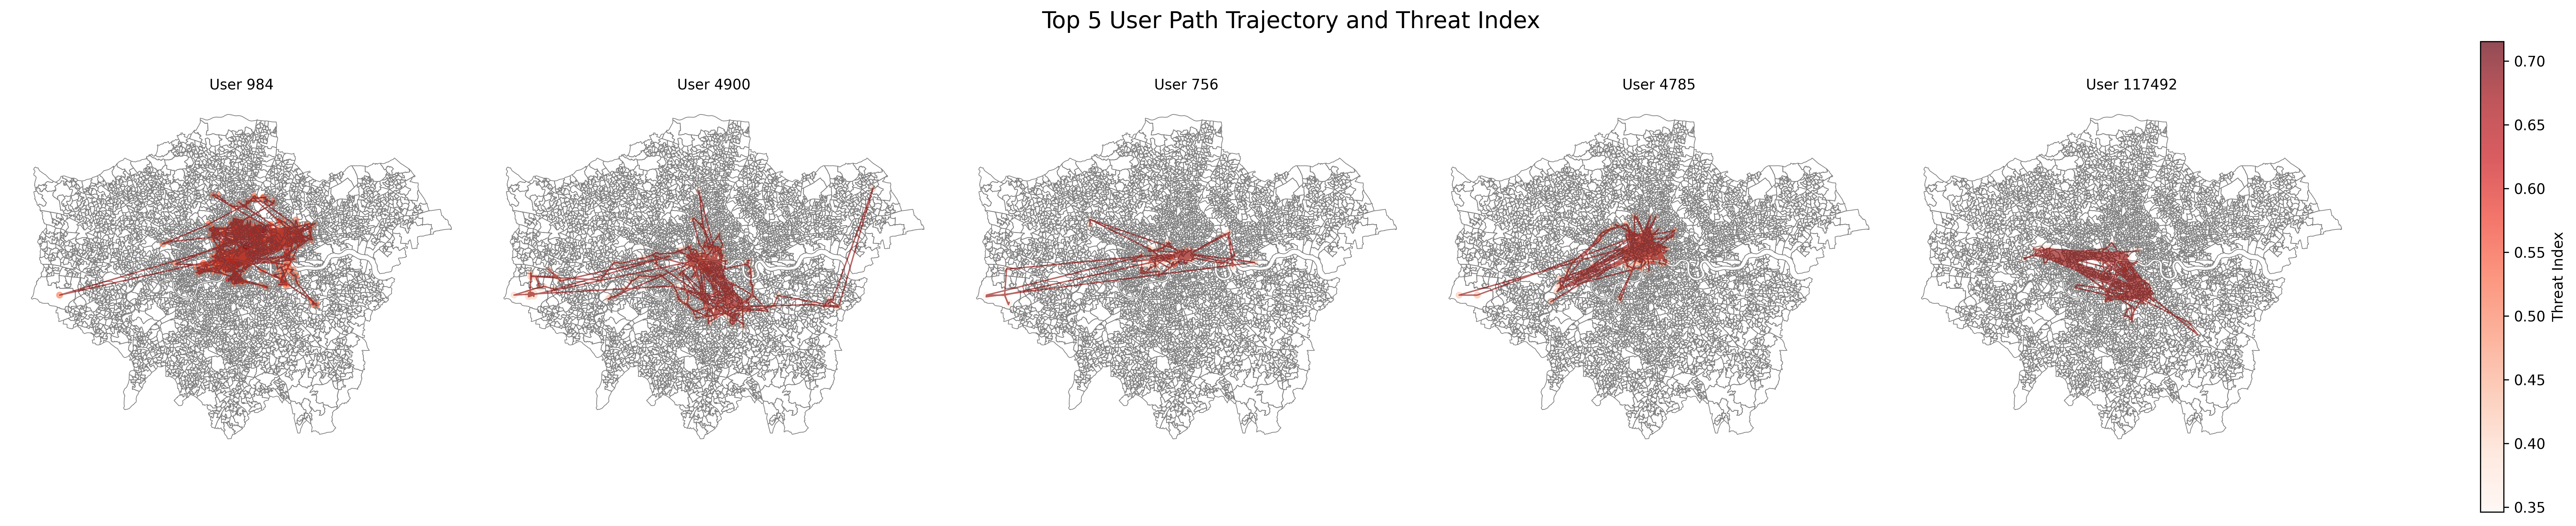
Tools Used
- Python: Data cleaning, machine learning (Random Forest), PCA
- GIS: Spatial data processing,Trajectory Mapping
- Open Data: Gowalla check-in dataset, ONS & Police UK crime data, OpenStreetMap POIs
Data Sources: Gowalla; Office for National Statistics; Police UK; London Datastore; OpenStreetMap